📂 Charting 👁 2.5k views 🕐 June 17, 2026

vizGPT

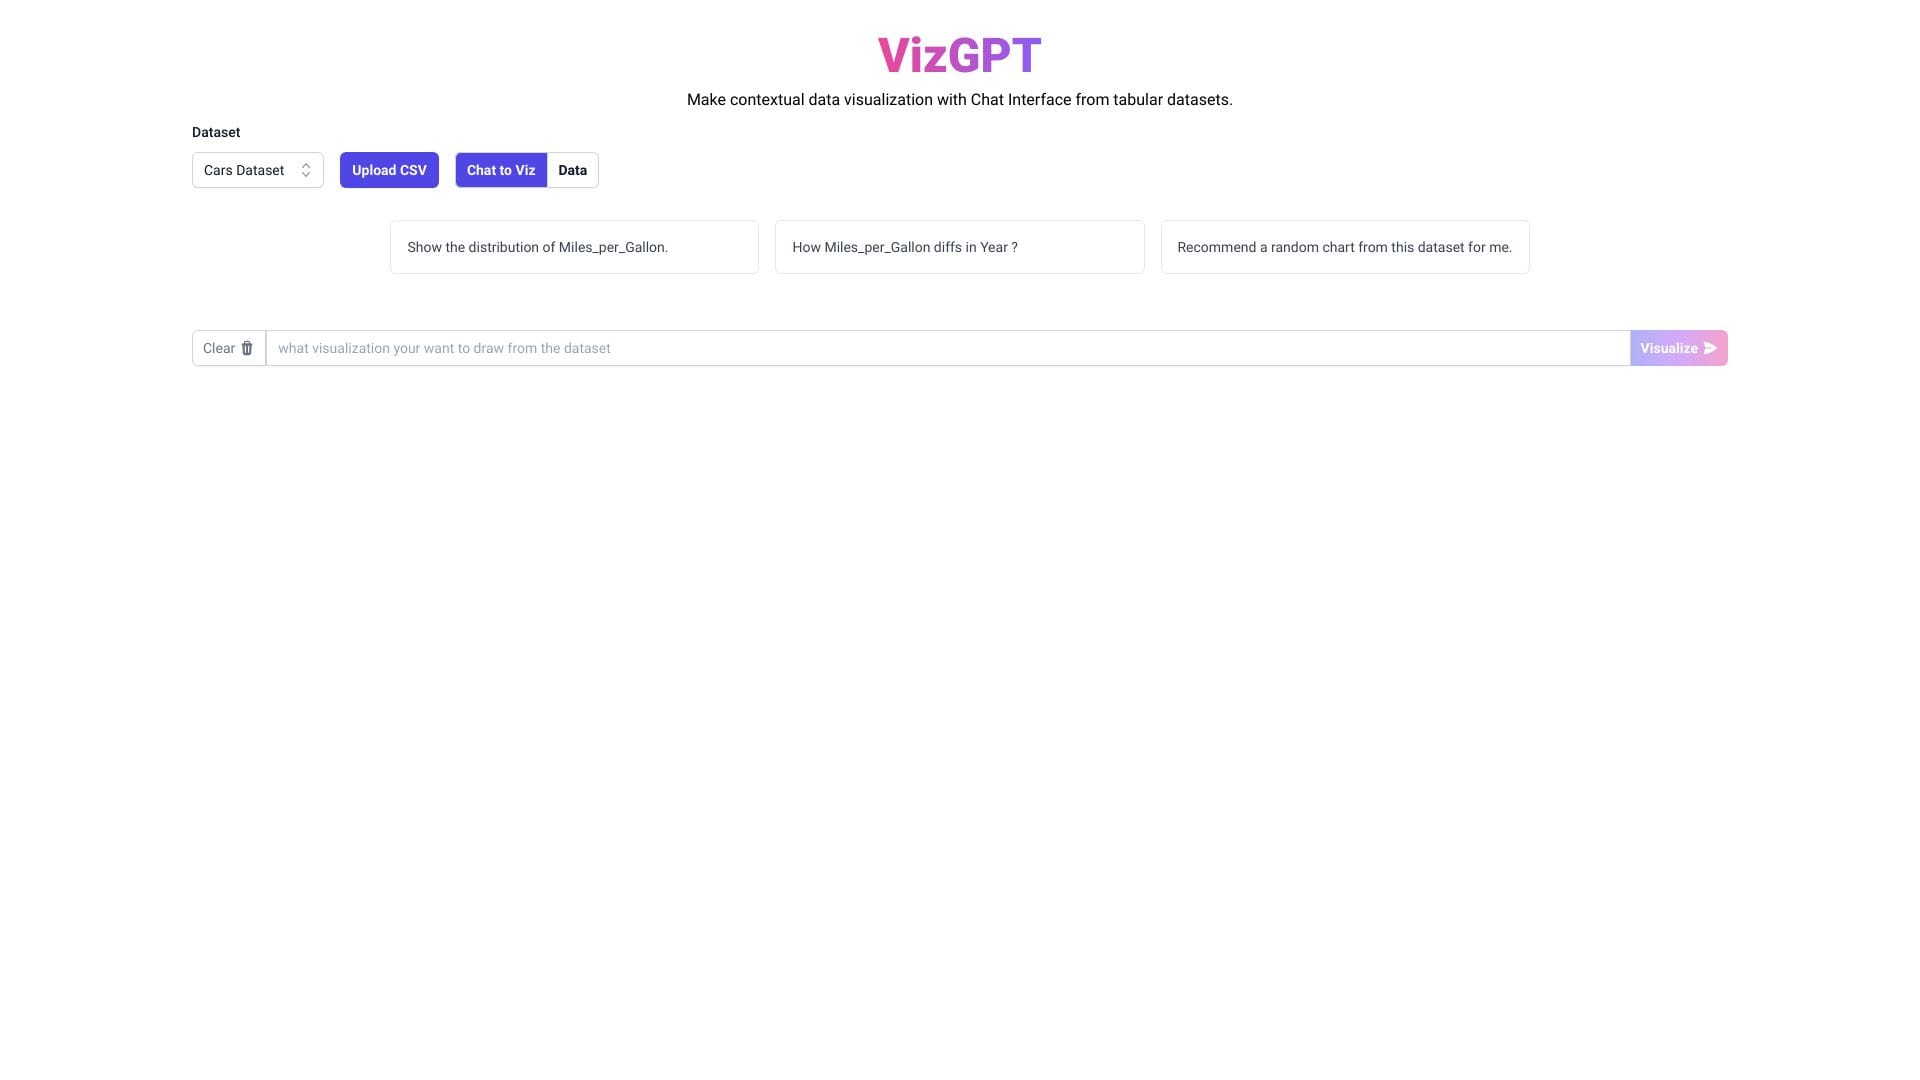
vizGPT is a charting tool designed for individuals and teams who need.

vizGPT is a charting tool designed for individuals and teams who need to create visual representations of their data. It is intended for those who want to make their data more understandable and engaging.
The way vizGPT works is by utilizing AI to generate charts and graphs based on the input data. This allows users to focus on the insights and trends in their data rather than spending time creating the visualizations themselves.
Those who get the most value from vizGPT are data analysts, business intelligence professionals, and anyone who needs to communicate complex data insights to their audience effectively. They benefit from vizGPT's ability to simplify the process of creating visualizations, making it easier to share data-driven stories.

Charting Chatbot Diagram Generator
Features
AI-powered chart generation
vizGPT uses artificial intelligence to create charts and graphs based on the input data.
Customizable visualizations
Users can adjust the appearance of their charts to fit their specific needs.
Data analysis
vizGPT can help users identify trends and patterns in their data.
Collaboration tools
vizGPT may offer features that allow teams to work together on data visualization projects.
Verdict
Best forTeams doing Charting work who need consistent output without a steep learning curve.
Skip ifYou only need this once or twice; the subscription cost won't pay off for occasional use.
Saves time: vizGPT automates the process of creating charts and graphs, freeing up time for more strategic tasks.
Enhances data understanding: By providing clear and concise visualizations, vizGPT helps users gain deeper insights into their data.
Improves communication: vizGPT's visualizations can be used to effectively communicate complex data insights to both technical and non-technical audiences.
Limited control: The AI-powered nature of vizGPT might limit the level of control users have over the final product.
Dependence on data quality: vizGPT is only as good as the data it is given, so poor data quality can lead to inaccurate or misleading visualizations.
Alternatives
ToolPricingUpvotesRating
Archimyst Freemium ▲ 178 4.0
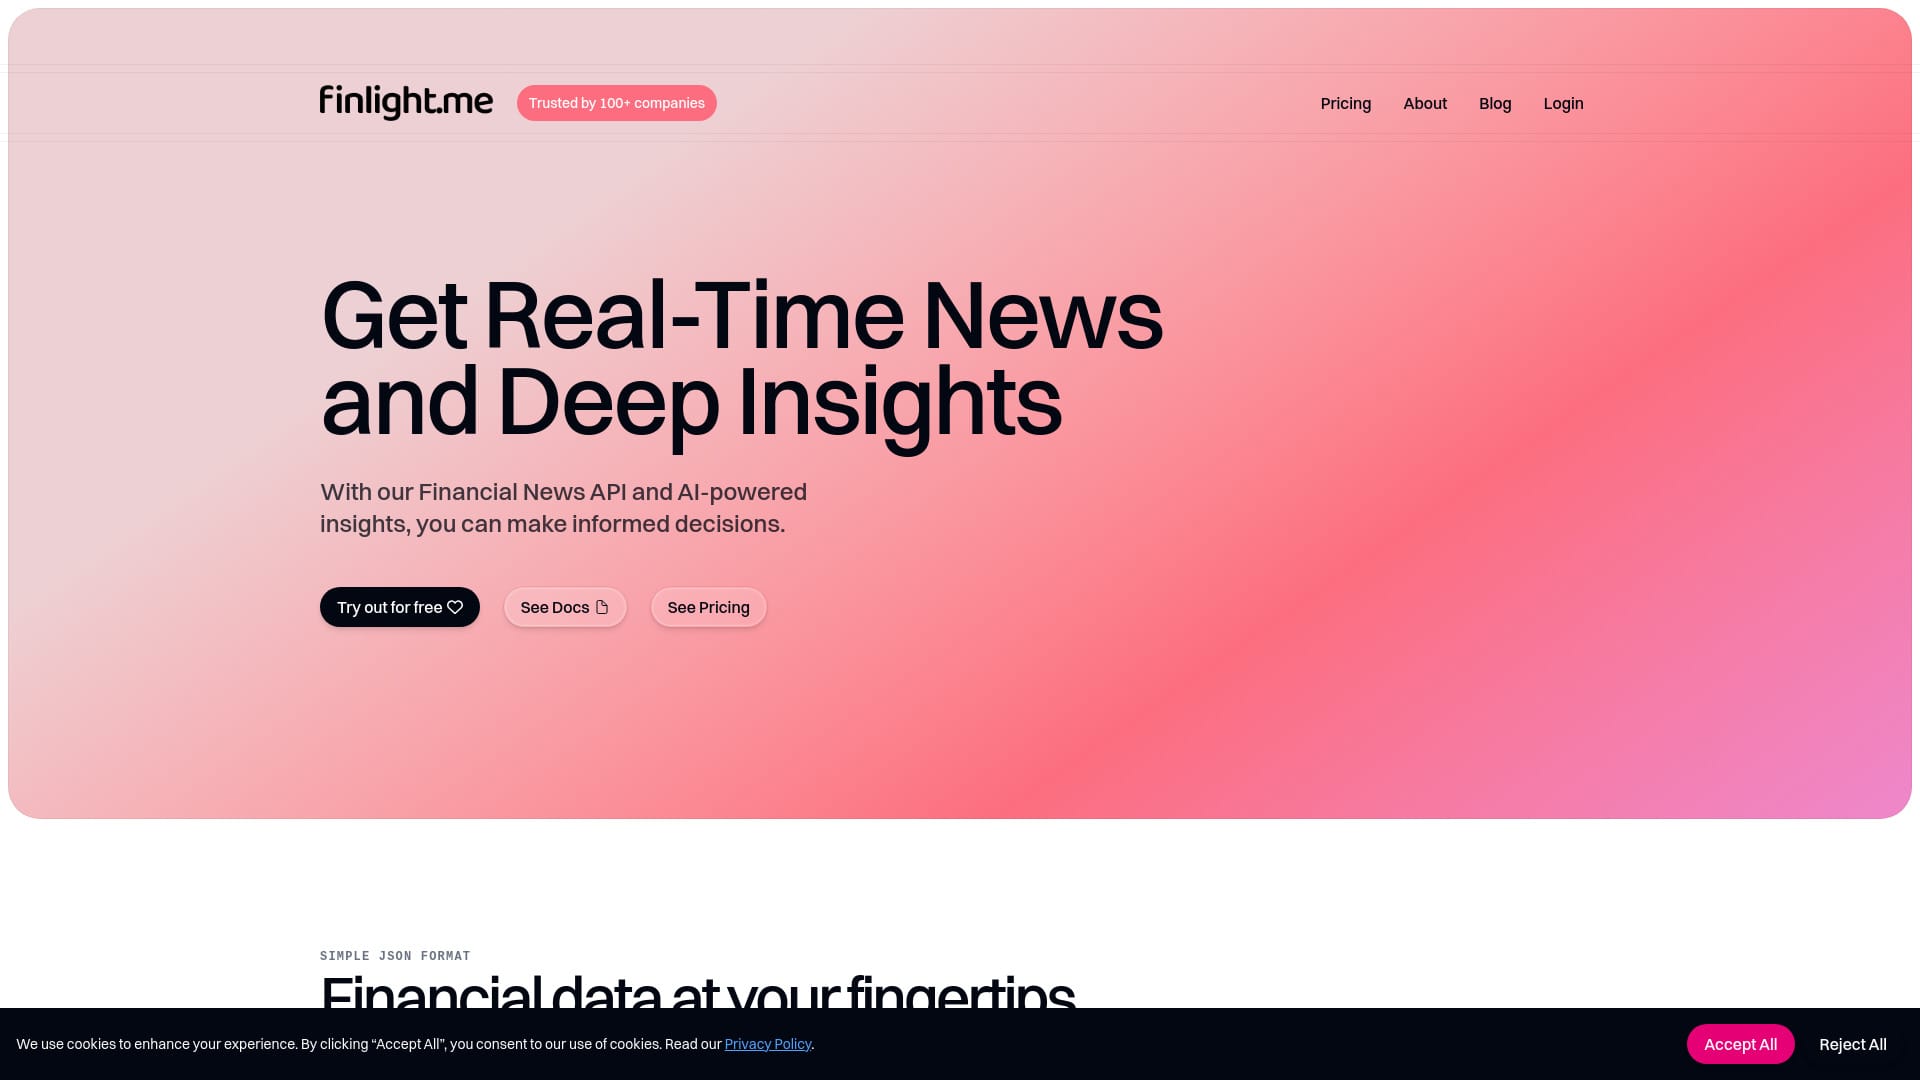
finlight.me Freemium ▲ 58 4.8
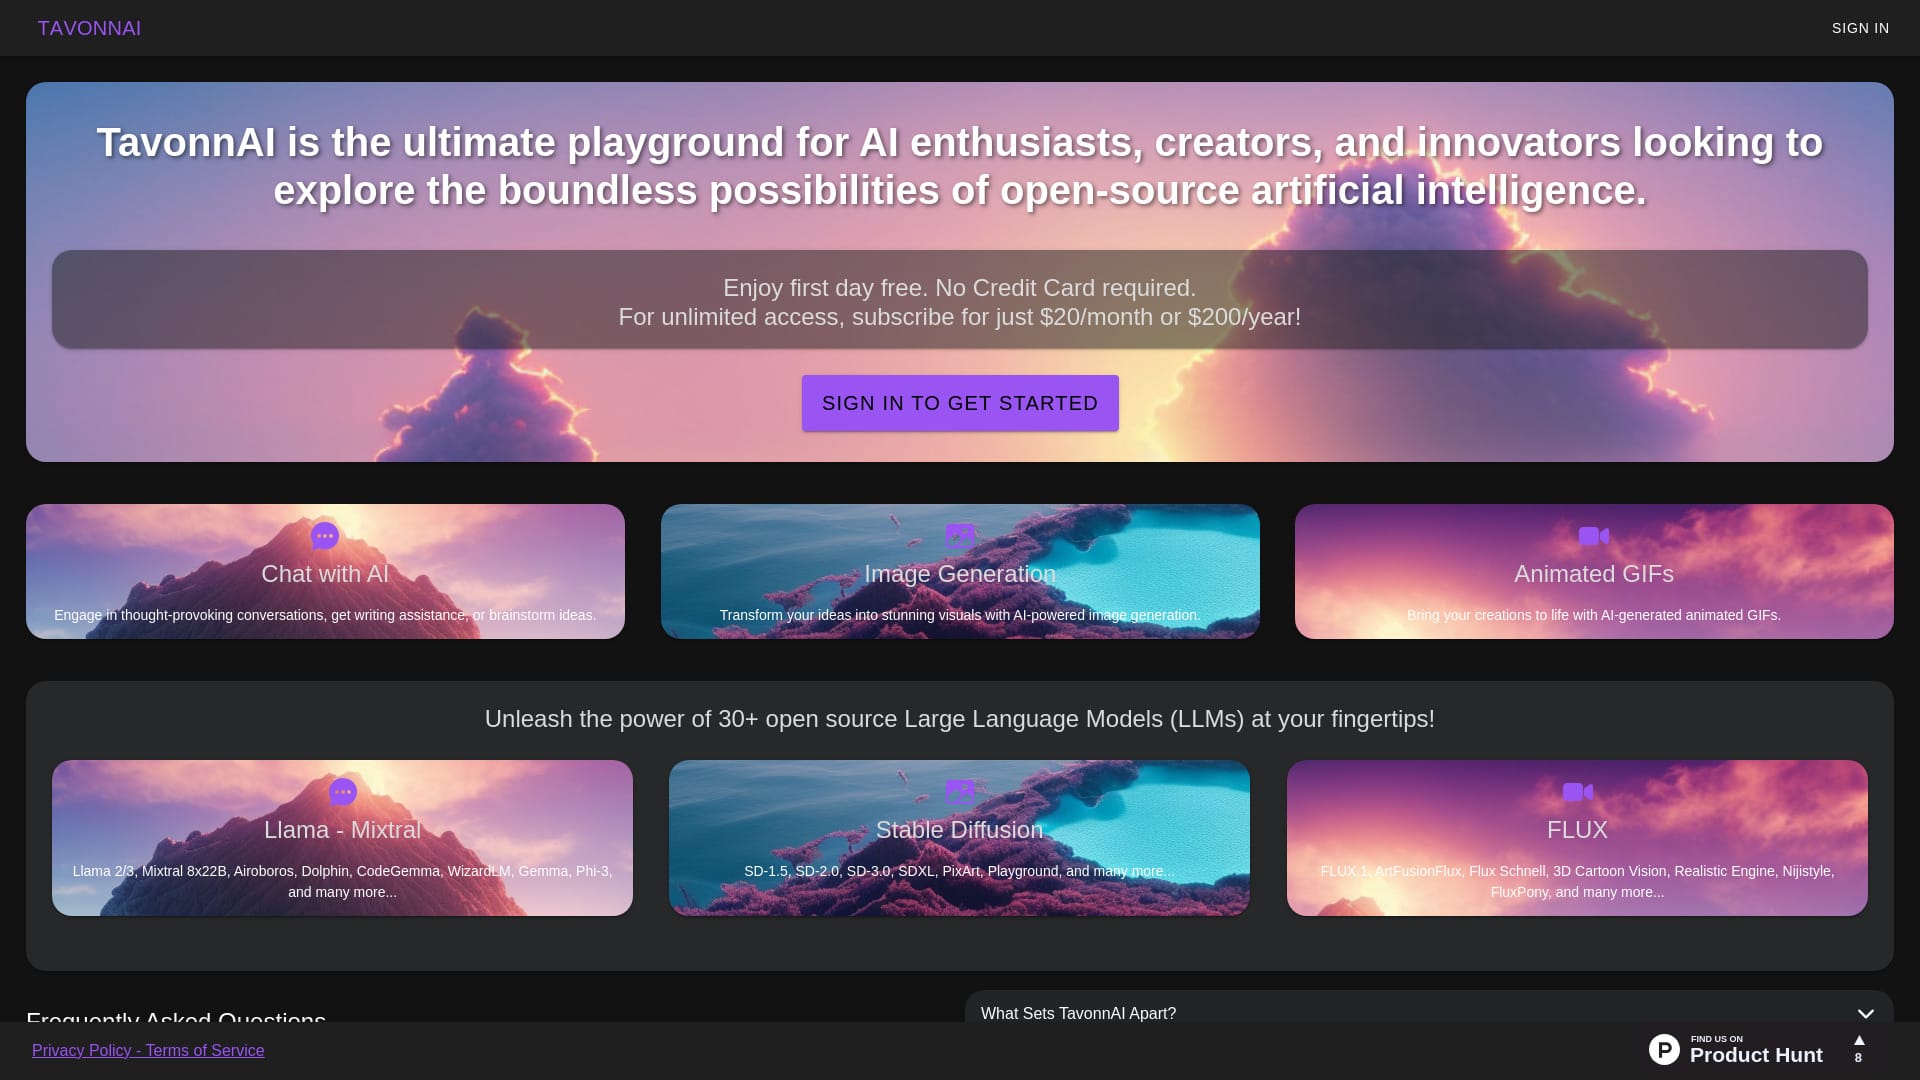
TavonnAI Freemium ▲ 247 4.9
Frequently Asked Questions
vizGPT is used for creating visual representations of data, such as charts and graphs, to help users understand and communicate complex data insights.
vizGPT is designed to be user-friendly, with an AI-powered approach that automates the process of creating visualizations, making it accessible to users with varying levels of technical expertise.
The integration capabilities of vizGPT are not well-documented, but it may offer connections to popular data analysis and business intelligence platforms.
The benefits of using vizGPT include saving time, enhancing data understanding, and improving communication of complex data insights.
The comparison of vizGPT to other charting tools is not well-documented, but it is likely that vizGPT's AI-powered approach sets it apart from more traditional visualization tools.
Reviews
📝
No reviews yet
Be the first to share your experience with vizGPT.
Submit a Review

Your email address will not be published. Required fields are marked *

vizGPT
vizGPT
Freemium
Visit Site ↗
Home Prompts