Chartify
Chartify is a data visualization tool designed for individuals and teams looking.
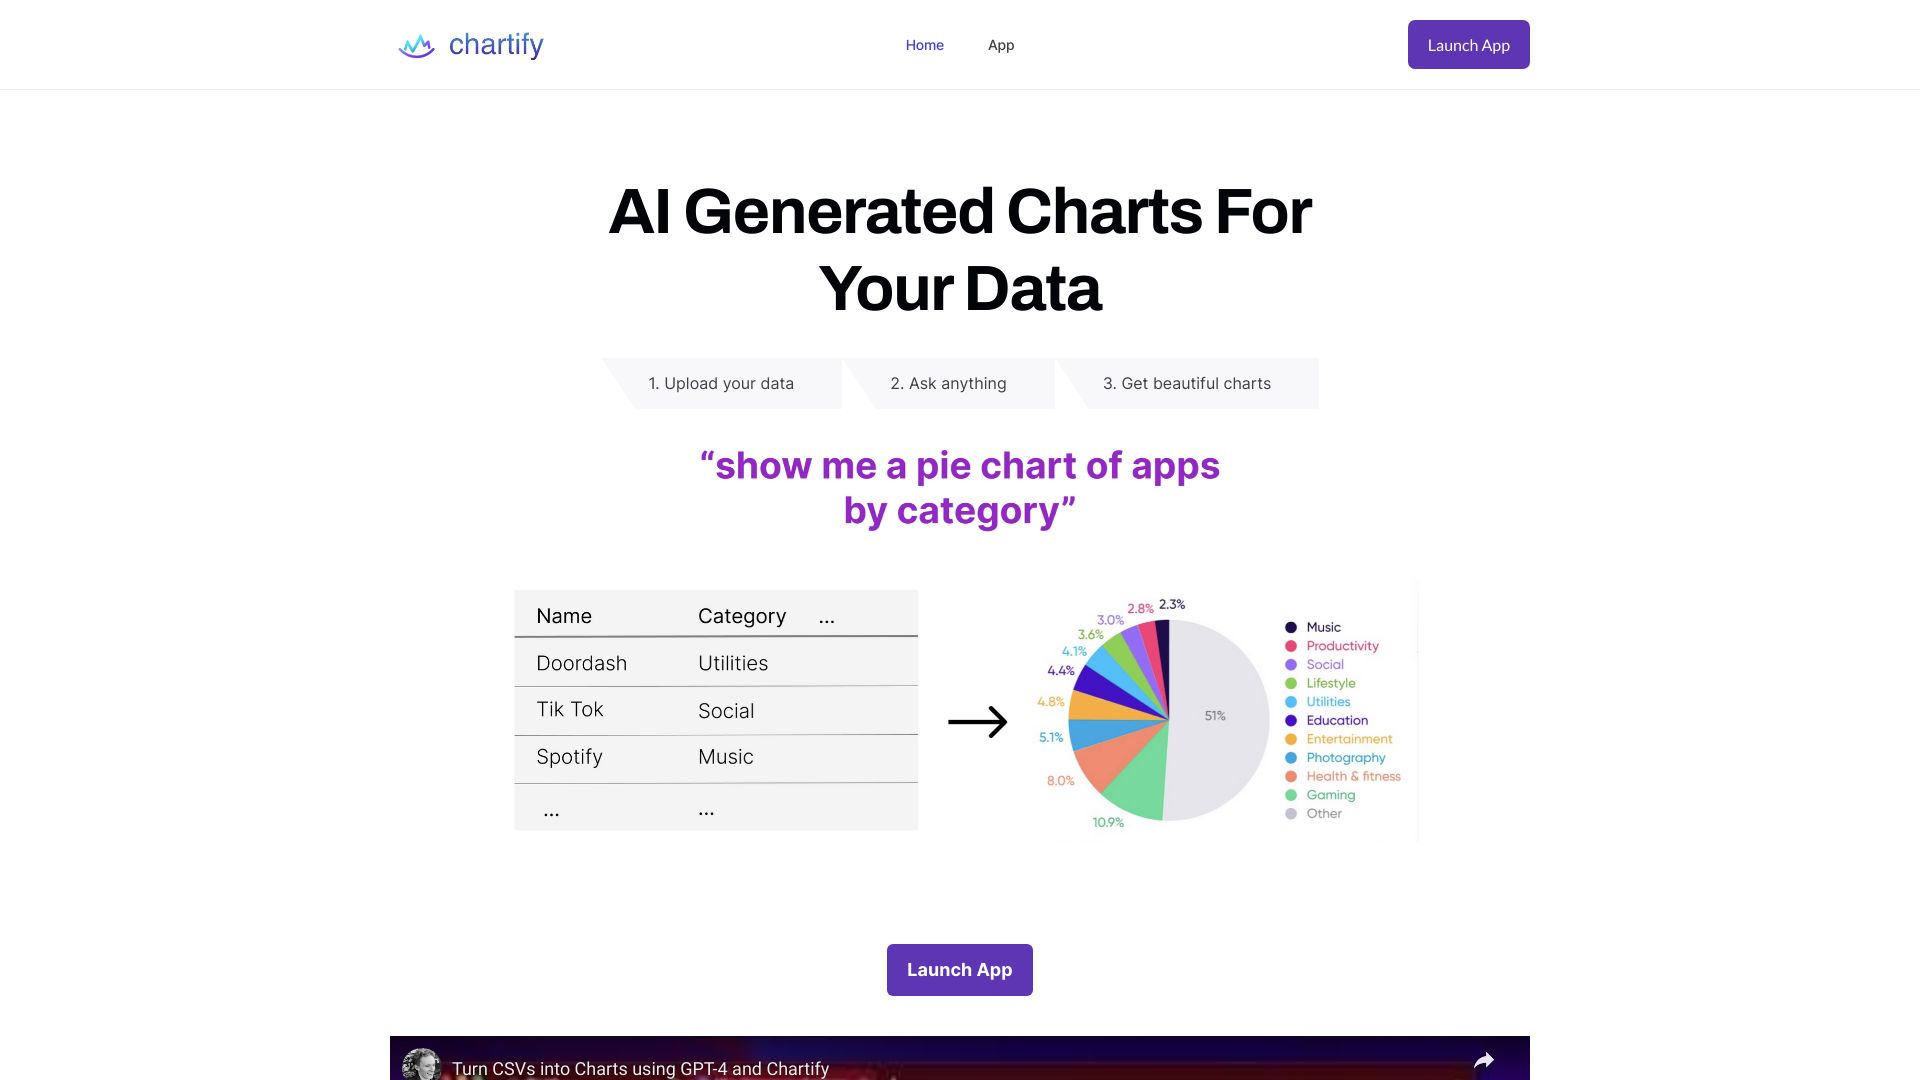
Chartify is a data visualization tool designed for individuals and teams looking to turn complex data into understandable and actionable insights. It's aimed at those who need to communicate data findings effectively, whether in business, research, or education. Chartify is intended to simplify the process of creating visual representations of data, making it easier for users to analyze and share their findings.
The way Chartify works involves users inputting their data, which can come from various sources such as spreadsheets, databases, or manually entered information. Once the data is loaded, Chartify provides options for customizing the appearance and type of chart or graph that best represents the data. This could range from simple bar charts and line graphs to more complex visualizations like scatter plots and heat maps. The key capability of Chartify is its ability to automatically suggest the most appropriate type of chart based on the data provided, streamlining the decision-making process for users.
Professionals and teams in data-intensive fields such as marketing, finance, and research get the most value from Chartify. This is because they often deal with large datasets and need to extract meaningful insights quickly. Chartify helps them achieve this by providing an intuitive interface for data visualization, thus facilitating better decision-making and more effective communication of their findings to stakeholders.
| Tool | Pricing | Upvotes | Rating |
|---|---|---|---|
 Archimyst
 |
Freemium | ▲ 178 | ★ 4.0 |
 finlight.me
 |
Freemium | ▲ 58 | ★ 4.8 |
 Birthday Wingman
 |
Freemium | ▲ 168 | ★ 4.8 |